Note
Go to the end to download the full example code.
Boosting density representation
Describes how speed up histogram representation of ensemble spectral density.
# Author: Alejandro Santorum Varela
# License: BSD 3-Clause

import time

from skrmt.ensemble import GaussianEnsemble, WishartEnsemble
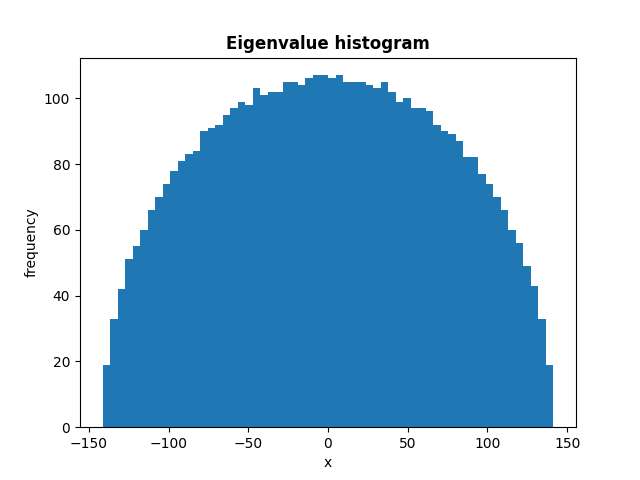
We can sample a random matrix of the Gaussian Ensemble with a relatively large size and plot its spectral density.
goe = GaussianEnsemble(beta=1, n=5000)

t1 = time.time()
goe.plot_eigval_hist(bins=60, density=False, normalize=False)
t2 = time.time()
The time needed to compute the previous histogram is:
print(t2-t1, 'seconds')
7.273745059967041 seconds
We can speed up this procedure using the tridiagonal form of Gaussian
Ensemble random matrices: tridiagonal_form=True.
goe_tridiag = GaussianEnsemble(beta=1, n=5000, tridiagonal_form=True)

t1 = time.time()
goe_tridiag.plot_eigval_hist(bins=60, density=False, normalize=False)
t2 = time.time()

The time needed to compute the previous histogram is:
print(t2-t1, 'seconds')
0.2736492156982422 seconds
This boosting trick can be used with Wishart Ensemble too
wre = WishartEnsemble(beta=1, p=5000, n=10000)

t1 = time.time()
wre.plot_eigval_hist(bins=60, density=False, normalize=False)
t2 = time.time()

The time needed to compute the previous histogram is:
print(t2-t1, 'seconds')
7.242355823516846 seconds
Using tridiagonal form of the Wishart Ensemble by setting tridiagonal_form=True.
wre_tridiag = WishartEnsemble(beta=1, p=5000, n=10000, tridiagonal_form=True)

t1 = time.time()
wre_tridiag.plot_eigval_hist(bins=60, density=False, normalize=False)
t2 = time.time()

The time needed to compute the previous histogram is:
print(t2-t1, 'seconds')
0.2683908939361572 seconds
Total running time of the script: (0 minutes 19.115 seconds)